Tutorial 10 — The browser viewer
The viewer (viz/, TypeScript + three.js) shows networks in 3D and simulates them live in the browser with the same
integer kernel as Python (identical spikes).
cd viz
npm ci
npm run build:kernel
npm run dev          # http://localhost:5173
Import a network JSON (from
net.save_json(...), the CLIgeneratecommand, orexport-presets).Orbit, pan and zoom; click a neuron to inspect and edit its parameters.
Colour neurons by region, role, sign, mode or compartment.
Run the simulation; watch spikes in 3D and in the raster of selected populations.
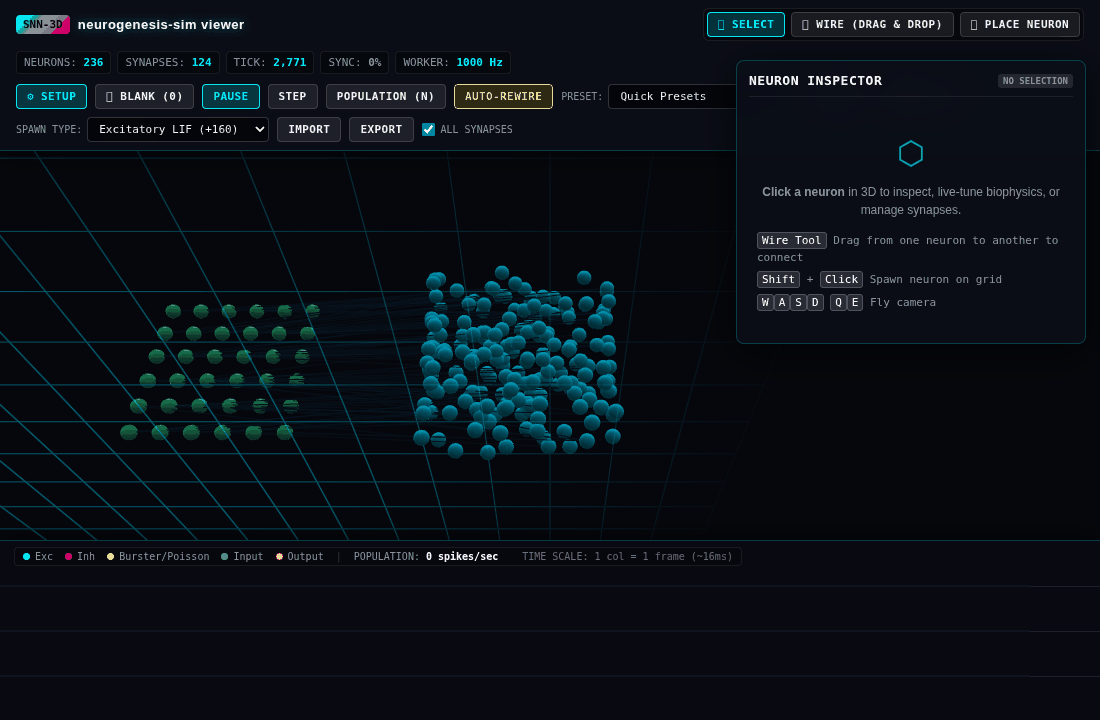
The grown topographic map of tutorial 2 (seed 0, 236 neurons, 124 synapses) imported into the viewer: sensor sheet (left) and map (right).
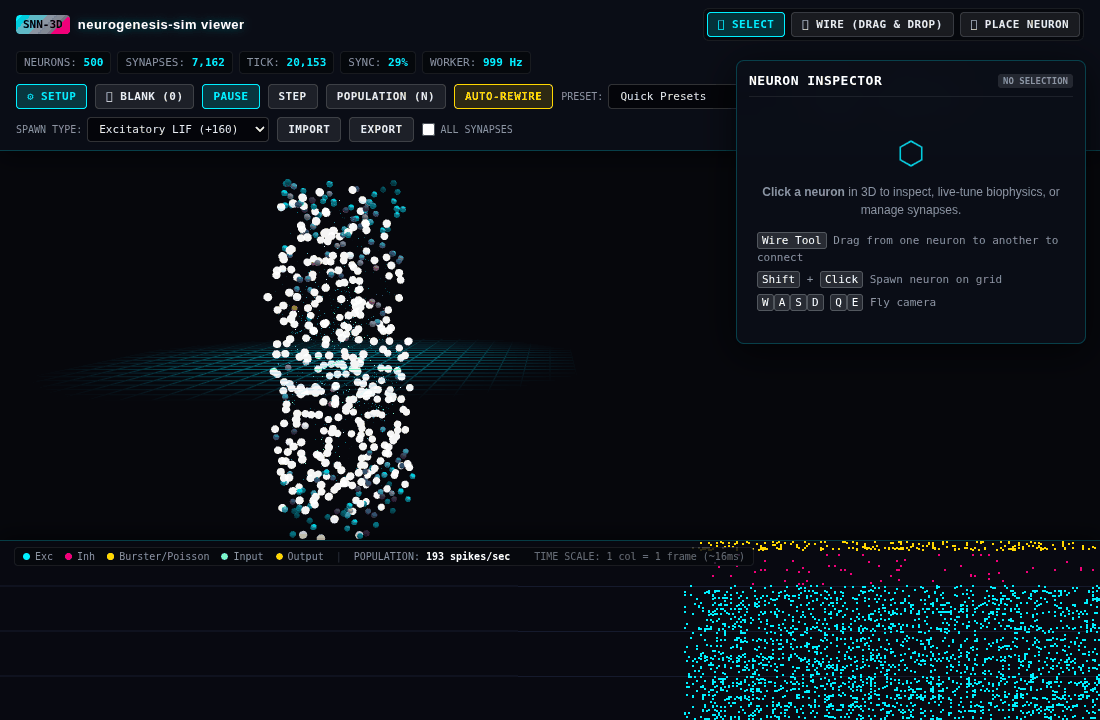
The CLI column (generate --neurons 500 --weight-scale 0.2 --refractory 3) simulated live in the browser; white
neurons are spiking, and the population raster scrolls at the bottom right.
PLACEHOLDER
A GIF of the viewer simulating a network while the camera orbits (docs/_scripts/viewer_capture.py writes it, but
headless software-WebGL capture was too heavy for the documentation build machine; capture it on a desktop
with a GPU).
The viewer is the reference implementation of the browser kernel and the lightweight web demo. Full editors (projects, geometry, fields, schedules) live in the desktop apps (Tutorial 11 — Desktop apps).
PLACEHOLDER
A hosted web demo on GitHub Pages (the built viewer with preset networks), embedded in this page.